
Flow Metrics
Lead time, PCE, takt time and the bottleneck — instantly, with every change.
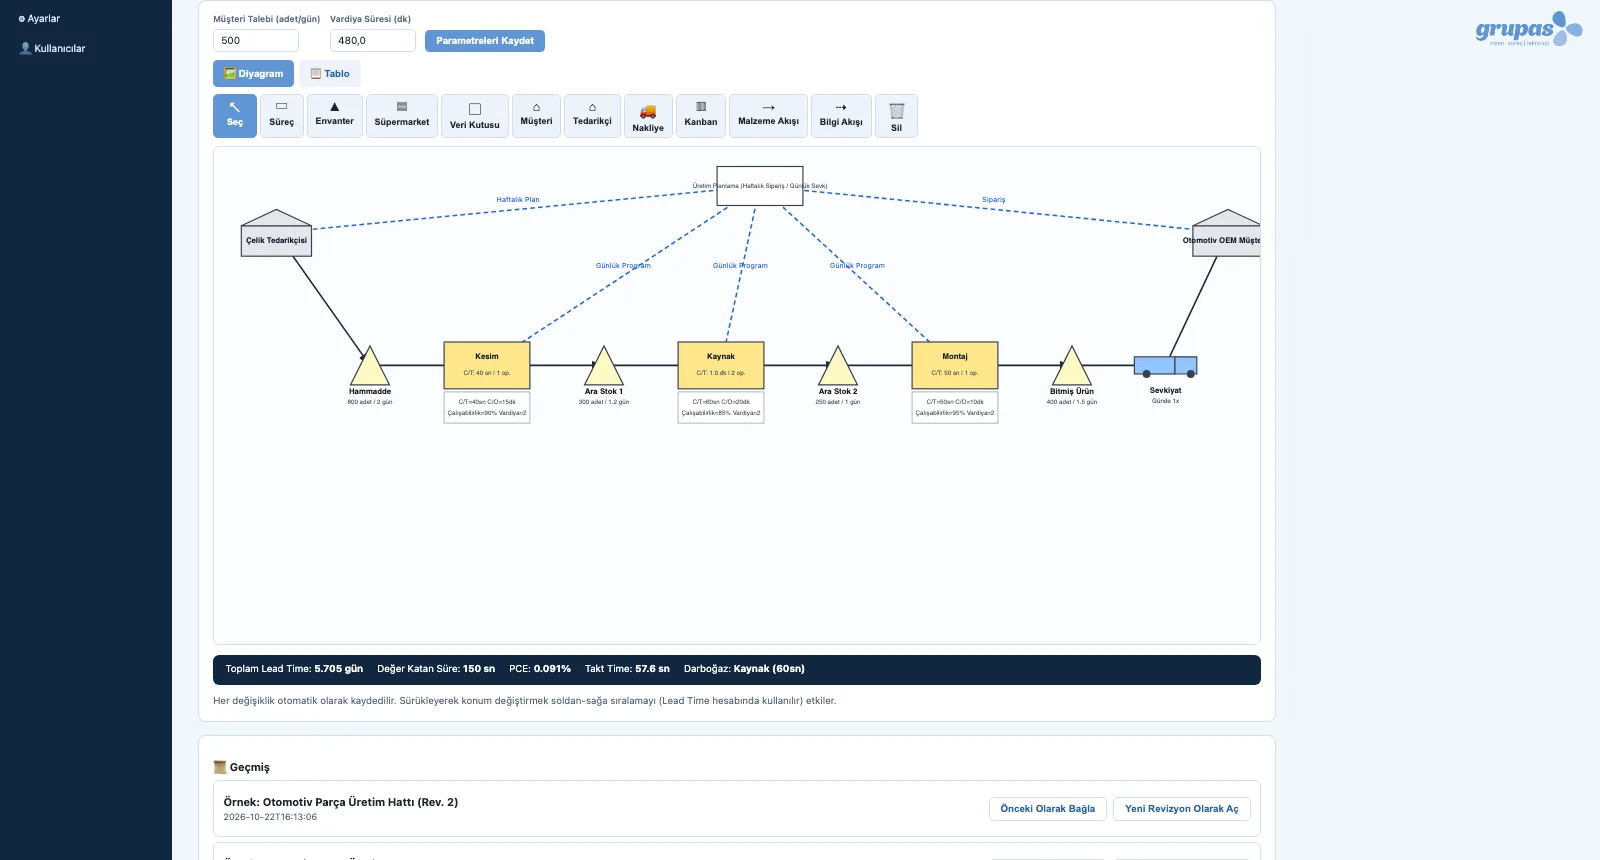
VALUEX calculates the flow metrics from the map itself: total lead time, value-added time, process cycle efficiency (PCE), takt time and the bottleneck station are always current in the metrics bar under the map.
What you gain with VALUEX
- The metrics bar recalculates on every symbol, data or connection change.
- Current- and future-state metrics are calculated separately and can be read side by side.
How it works
See the numeric picture of the flow together with the map.
-
1
Enter demand and shift time
Enter daily customer demand and shift time; takt time and day conversions follow from them. The metrics bar sits right under the map.
-
2
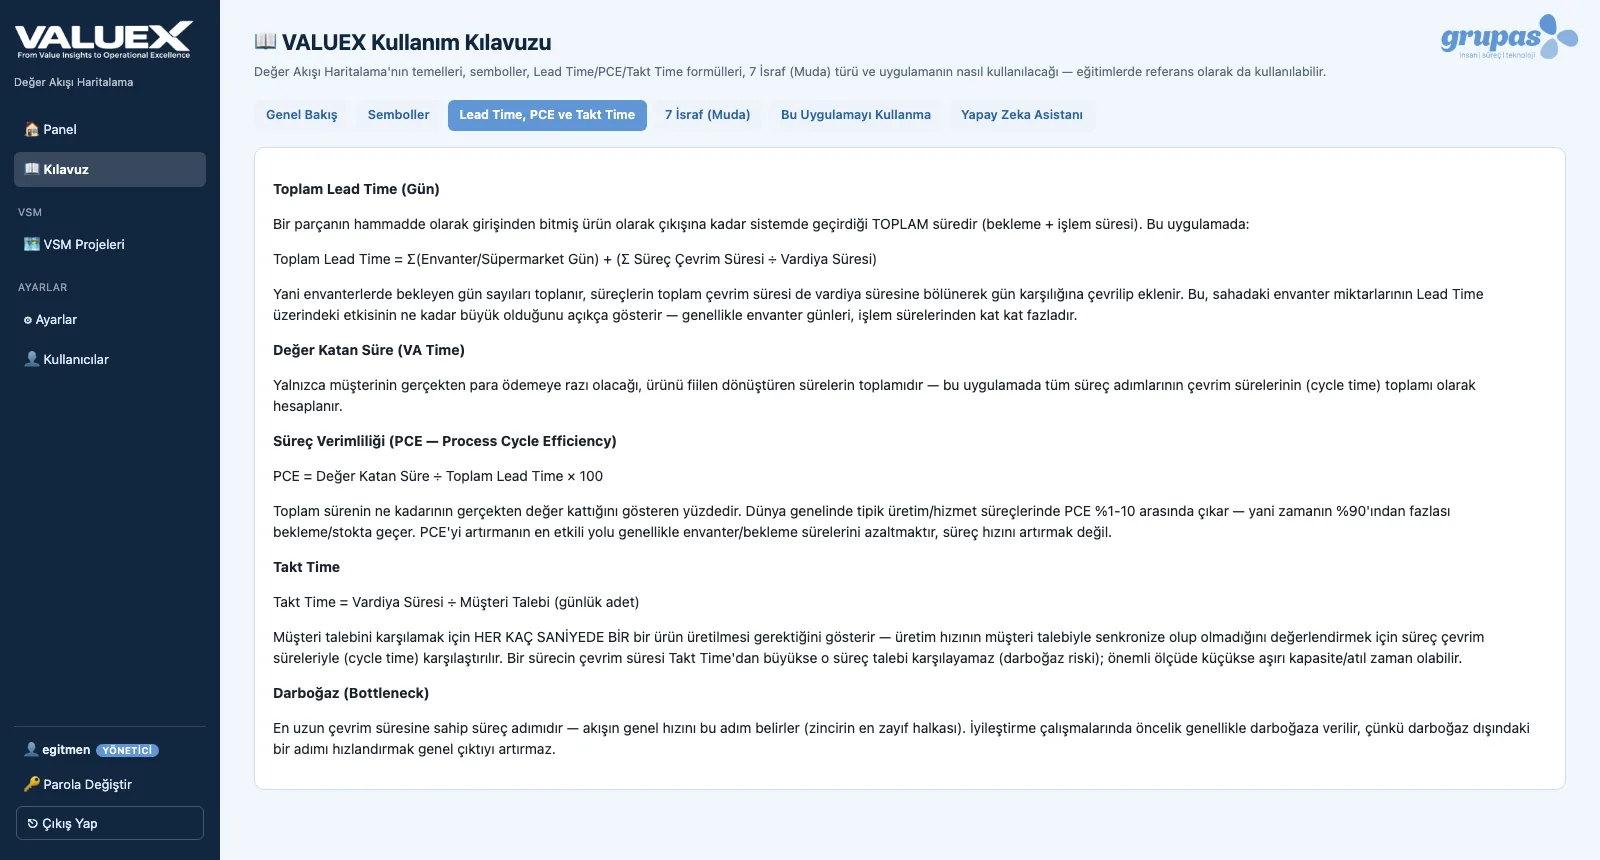
See the formulas
Lead time, value-added time, PCE, takt time and bottleneck definitions are in the guide; the team knows how it is calculated.
-
3
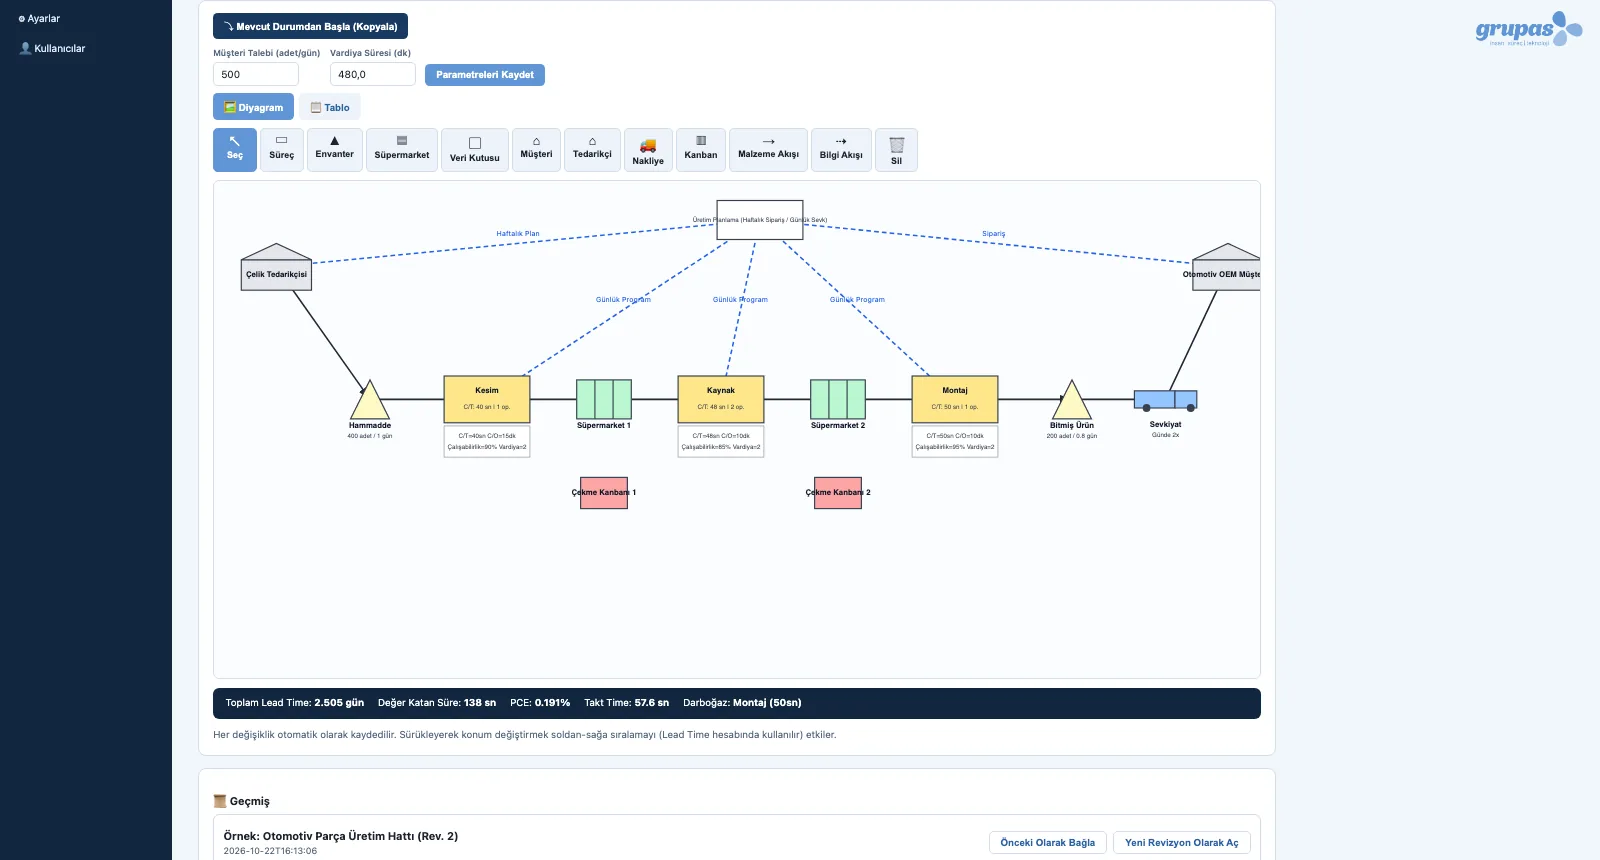
Compare with the future state
The same metrics are recalculated on the future-state map; the change in lead time and PCE reads directly.
Screens are shown with sample company data; the application interface is in Turkish.
Purpose
To show in numbers how much of the time in the flow really adds value, and which station limits demand.
Features
- Total lead time = Σ inventory / supermarket days + process cycle times (in days, by shift length)
- Value-added time and PCE (value-added time ÷ total lead time)
- Takt time = shift time ÷ daily customer demand
- Bottleneck: the process step with the longest cycle time
- All formulas are written out in the in-app guide
Benefits
- No manual math, no formula errors
- The effect of waiting and inventory becomes visible in numbers
- Improvement priorities become clear
Who uses it
Lean teams, production managers, planning and process engineers.